
Team Prosper NextGen Home Loans
Page 1 / 3
A Realtor's Guide

How Mortgage Rates Really Move.

The four things that drive rates every week, explained in plain English. Built for agent partners who want to sound like the smartest person in the room when a buyer panics about rates.

01
MBS
Where rates actually come from
02
10-Yr Treasury
The benchmark to watch
03
Inflation
The biggest single driver
04
Jobs Report
Why good news is bad news
By Alex Martinez
NextGen Home Loans · Team Prosper
Keep reading
Page 2 / 3 · How It Works

Rates come from one place.

The bond market. Not the bank, not the Fed. Investors decide every day what they'll pay for mortgage bonds, and that price is your buyer's rate. Once you see the mechanic, every rate move starts making sense.

The Foundation · How Bond Prices Move Rates
Bond prices and rates are on a seesaw. When one goes up, the other goes down.
Investors are scared
Bad economic news investors buy bonds for safety bond prices up yields down mortgage rates down
Investors are confident
Strong economy investors sell bonds to chase stocks bond prices down yields up mortgage rates up
Counterintuitive but true: good economic news is bad for your buyer's rate. Bad economic news is good. Once that clicks, you understand 80% of rate movement.
Driver 01 · Highest Impact
Inflation
CPI · PCE Reports
CPI: 2nd week of each month, 8:30am ET
PCE: Last Friday of each month

Inflation is the #1 enemy of bond investors. If they're earning 4% on a Treasury but prices are rising 5% per year, they're losing money in real terms. So when inflation prints hot, they sell bonds and demand higher yields to compensate.

The market reacts to the surprise, not the headline. If economists forecasted 3.1% CPI and it prints at 3.4%, that's a hot surprise. Mortgage rates typically move 5 to 15 basis points within an hour of the release.

Real Example
Forecast: 0.2% MoM CPI. Actual: 0.4%. That's "hot." Within minutes, the 10-Year Treasury yield jumps 0.10%, mortgage rates climb 0.125% by noon, and your buyer's pre-approval payment goes up around $35 per $400K borrowed.
Driver 02 · Live Readout
10-Yr Treasury
The Daily Benchmark
Trades live: Mon to Fri, 8am to 5pm ET
Ticker: TNX on CNBC or Google

The 10-year Treasury is the safest 10-year bet in the world. Every other long-term safe investment competes with it for capital, which means mortgage rates move in near lock-step with the 10-year yield.

The formula realtors should memorize: Mortgage Rate ≈ 10-Yr Treasury Yield + 1.5% to 2.0% spread. When the 10-year jumps 0.10% before noon, your buyer's rate has already moved with it. Locking decisions should respond to this, not to last week's headlines.

Quick Math
If the 10-year is sitting at 4.20% this morning, expect 30-year mortgage rates around 5.70% to 6.20%. If it moves to 4.40% by Thursday, expect rates in the 5.90% to 6.40% range by Friday.
Driver 03 · Economic Pulse
Jobs Report
Non-Farm Payrolls (NFP)
Released: First Friday of every month
Time: 8:30am ET sharp

Three numbers from the jobs report move bonds: jobs added (vs forecast), the unemployment rate, and wage growth. Strong jobs signal a hot economy, which signals future inflation, which sends bond investors selling. Rates climb.

Weak jobs flip everything. Slowing hiring, rising unemployment, or stalling wages tell investors the economy is cooling. They rush into bonds for safety (the "flight to quality" trade), driving prices up and yields down. Rates drop.

Watch This Pattern
Forecast was 180K jobs added. Actual: 275K plus wage growth at 0.5% MoM. Translation: hot. Mortgage rates rise the same day. The headline "great jobs report" on TV is bad news for your buyer trying to lock a rate that afternoon.
Driver 04 · The Misunderstood One
The Fed
FOMC Meetings & Powell's Tone
Meets: 8 times per year
What moves rates: The 2pm ET press conference

The Fed sets one rate: the federal funds rate (overnight bank-to-bank lending). They do not set mortgage rates directly. Mortgage rates respond to the bond market, which has usually already priced in the Fed's move weeks in advance.

What actually moves rates at a Fed meeting isn't the decision. It's Powell's tone during the press conference. Words like "patient," "data-dependent," or "we see more work to do" shift bond traders' expectations for the next 6 to 12 months. That's where the action is.

Common Myth
"The Fed cut rates today, so my buyer's mortgage will drop." Not necessarily. Mortgage rates often rise after a Fed cut if Powell sounds hawkish about future cuts. The bond market trades the FUTURE, not the past.
The Spread (why mortgage rate ≠ 10-Yr yield)
Mortgage Rate = 10-Yr Treasury Yield + Spread (1.5% to 2.0%)

Mortgages are riskier than Treasuries: people can default, refinance, or sell early. Investors demand a risk premium on top of the Treasury yield to take on that risk. That premium is the "spread."

When the spread widens above 2%, lenders are pricing in extra uncertainty (recession fear, volatility, regulatory shifts). When it narrows below 1.5%, the market is unusually competitive. Today's spread tells you how confident the lending side feels.

Page 3 / 3 · The Pro Move

Learn to read an MBS chart.

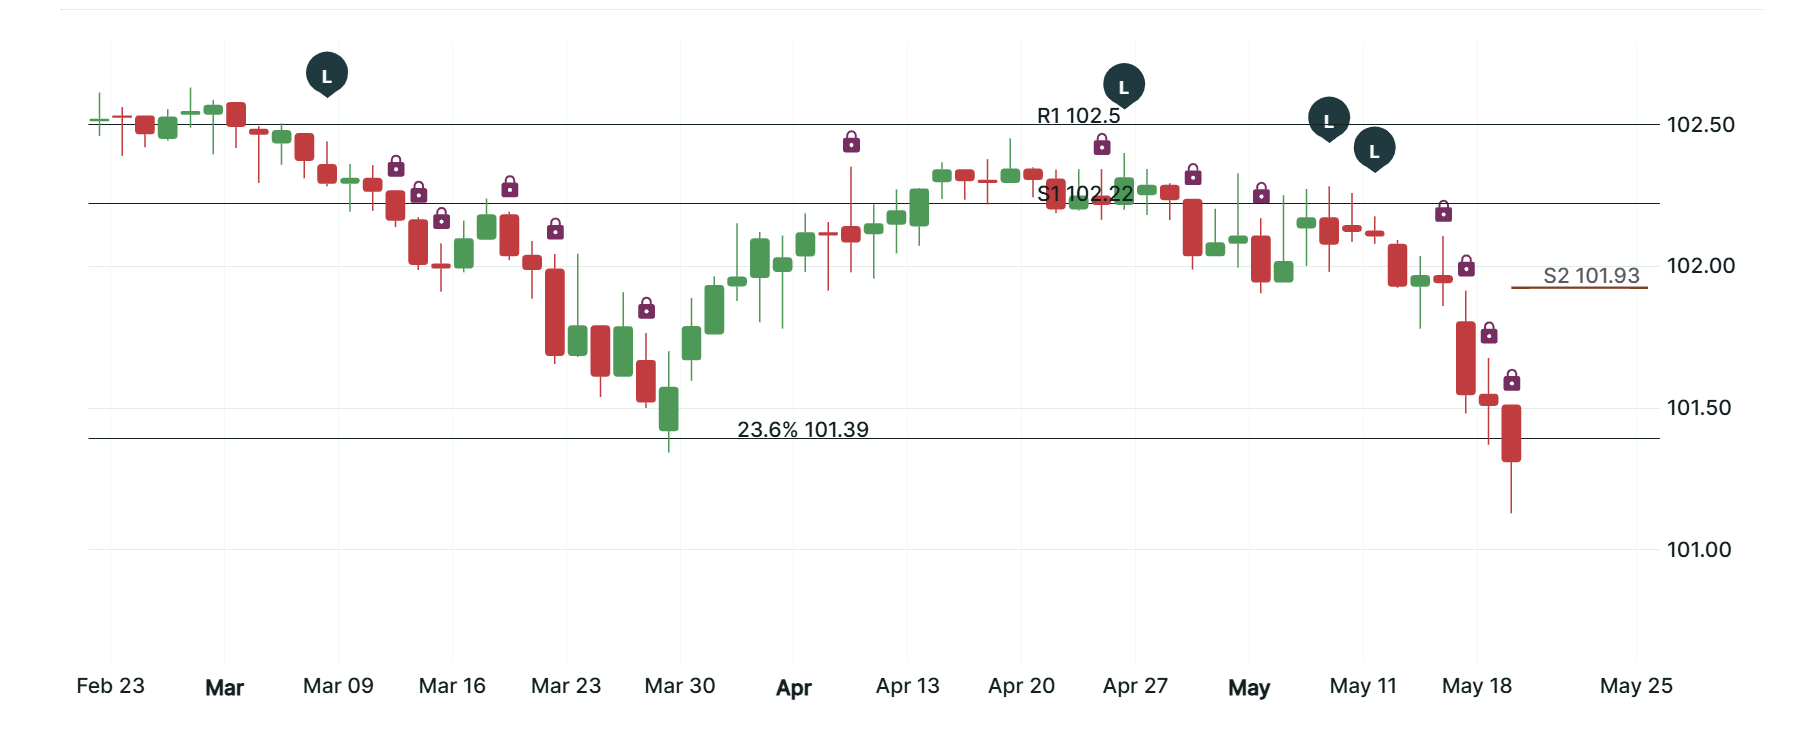
This is the live readout of what's happening to mortgage rates right now. Most agents have never seen one. After this, you'll check it before answering "where are rates?" Here's the cheat sheet.

UMBS 30-Yr daily candles with support, resistance, and lock alerts
Drop an MBS chart screenshot at
brand_assets/mbs-chart.png
A daily candle chart of UMBS 30-Yr current coupon works best
UMBS 30-Yr Daily · R/S Levels · L = Lock Alert · 🔒 = Lock Recommendation
MBS Price Up Green Day
When the chart goes green, bond investors are buying MBS. Prices climb, yields fall, and your buyer's rate moves down. Red is the opposite: investors selling, prices dropping, rates climbing. The chart and the rate sheet move in opposite directions.
01 · The Y-Axis
Read price, not rate.
The number on the side is the bond's price (e.g., 100.25 or 99.80). When this number rises, mortgage rates fall. When it drops, rates climb. Always inverse.
02 · The Coupon
Watch the "current coupon."
Lenders price loans off the UMBS coupon closest to today's rate (e.g., the 6.0 coupon when rates are around 6.5%). Make sure you're looking at the right one or the chart will mislead you.
03 · The Candles
Color tells you the day.
Green candle = MBS price up = rates down for the day. Red candle = MBS price down = rates up. Long wicks show intraday volatility (good locking opportunity if you see a deep wick rejected).
04 · Support & Resistance
Horizontal floors and ceilings.
MBS prices bounce off the same levels for days or weeks. Breaking through support usually means rates climb another 0.125% before stabilizing. Breaking resistance usually means a downward rate trend.
05 · Moving Averages
The 25- and 50-day lines.
Most MBS platforms overlay a 25-day and 50-day moving average. When price is above both, rates trending down. Below both, rates trending up. The crossover (golden/death cross) signals a regime shift worth telling clients about.
06 · Lock Alerts
The "L" bubbles and 🔒 icons.
MBS Highway flags moments to lock with "L" alerts when the market signals risk, plus small 🔒 icons on individual candles for lock recommendations. When you see these stacking up, your buyer's loan officer is probably about to call.
07 · Where to Watch
Free vs. pro tools.
Pro feeds: MBS Highway or MBSLive (your loan officer has one). Free version: search "UMBS 30-Yr current coupon" on TradingView, or watch FNMA on Yahoo Finance. Five minutes a day is plenty.
Alex Martinez
Divisional & Branch Manager · Loan Officer
NMLS #1960984 · DRE #02121826
Team Prosper NextGen Home Loans
For informational purposes only. Not a commitment to lend. All approvals subject to credit, income, asset, and property review. Rates and programs subject to change. NextGen Home Loans is an Equal Housing Opportunity Lender · NMLS #2280945 · DRE #01527806.